

- 创建初始黄金数据集以衡量性能
- 定义用于衡量性能的指标
- 在几个不同的提示或模型上运行评估
- 手动比较结果
- 跟踪随时间的结果
- 设置在 CI/CD 中运行的自动化测试
设置
首先安装本教程所需的依赖项。我们碰巧使用 OpenAI,但 LangSmith 可以与任何模型一起使用:创建数据集
准备测试和评估应用程序的第一步是定义要评估的数据点。这里有几个方面需要考虑:- 每个数据点的模式应该是什么?
- 我应该收集多少个数据点?
- 我应该如何收集这些数据点?
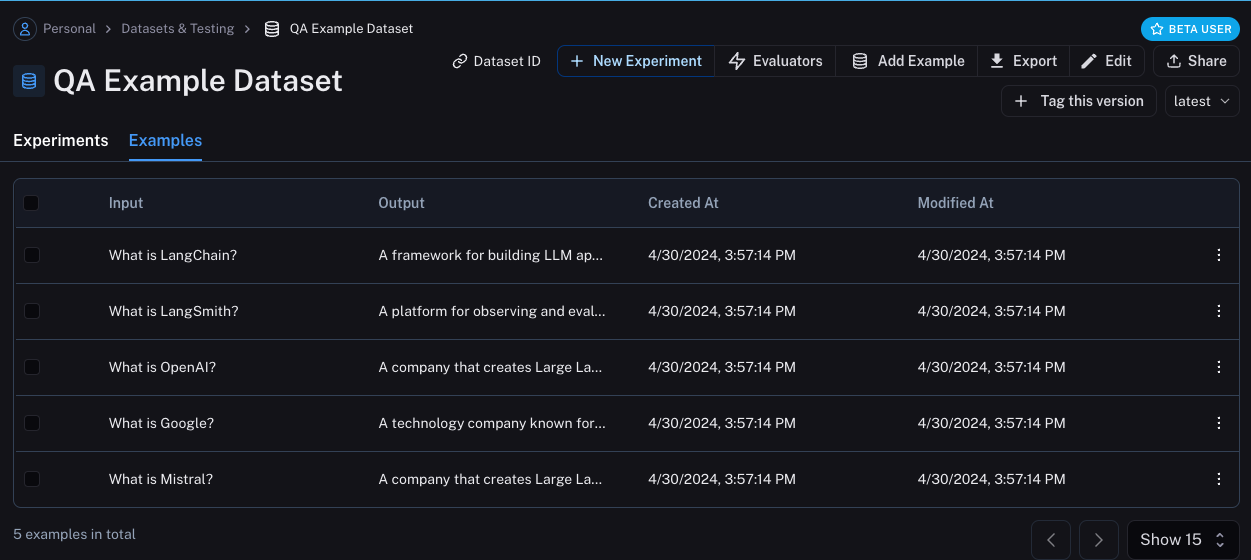
QA Example Dataset in the Datasets & Testing page, when we click into it we should see that we have five new examples.
Define metrics
After creating our dataset, we can now define some metrics to evaluate our responses on. Since we have an expected answer, we can compare to that as part of our evaluation. However, we do not expect our application to output those exact answers, but rather something that is similar. This makes our evaluation a little trickier. In addition to evaluating correctness, let’s also make sure our answers are short and concise. This will be a little easier - we can define a simple Python function to measure the length of the response. Let’s go ahead and define these two metrics. For the first, we will use an LLM to judge whether the output is correct (with respect to the expected output). This LLM-as-a-judge is relatively common for cases that are too complex to measure with a simple function. We can define our own prompt and LLM to use for evaluation here:Run Evaluations
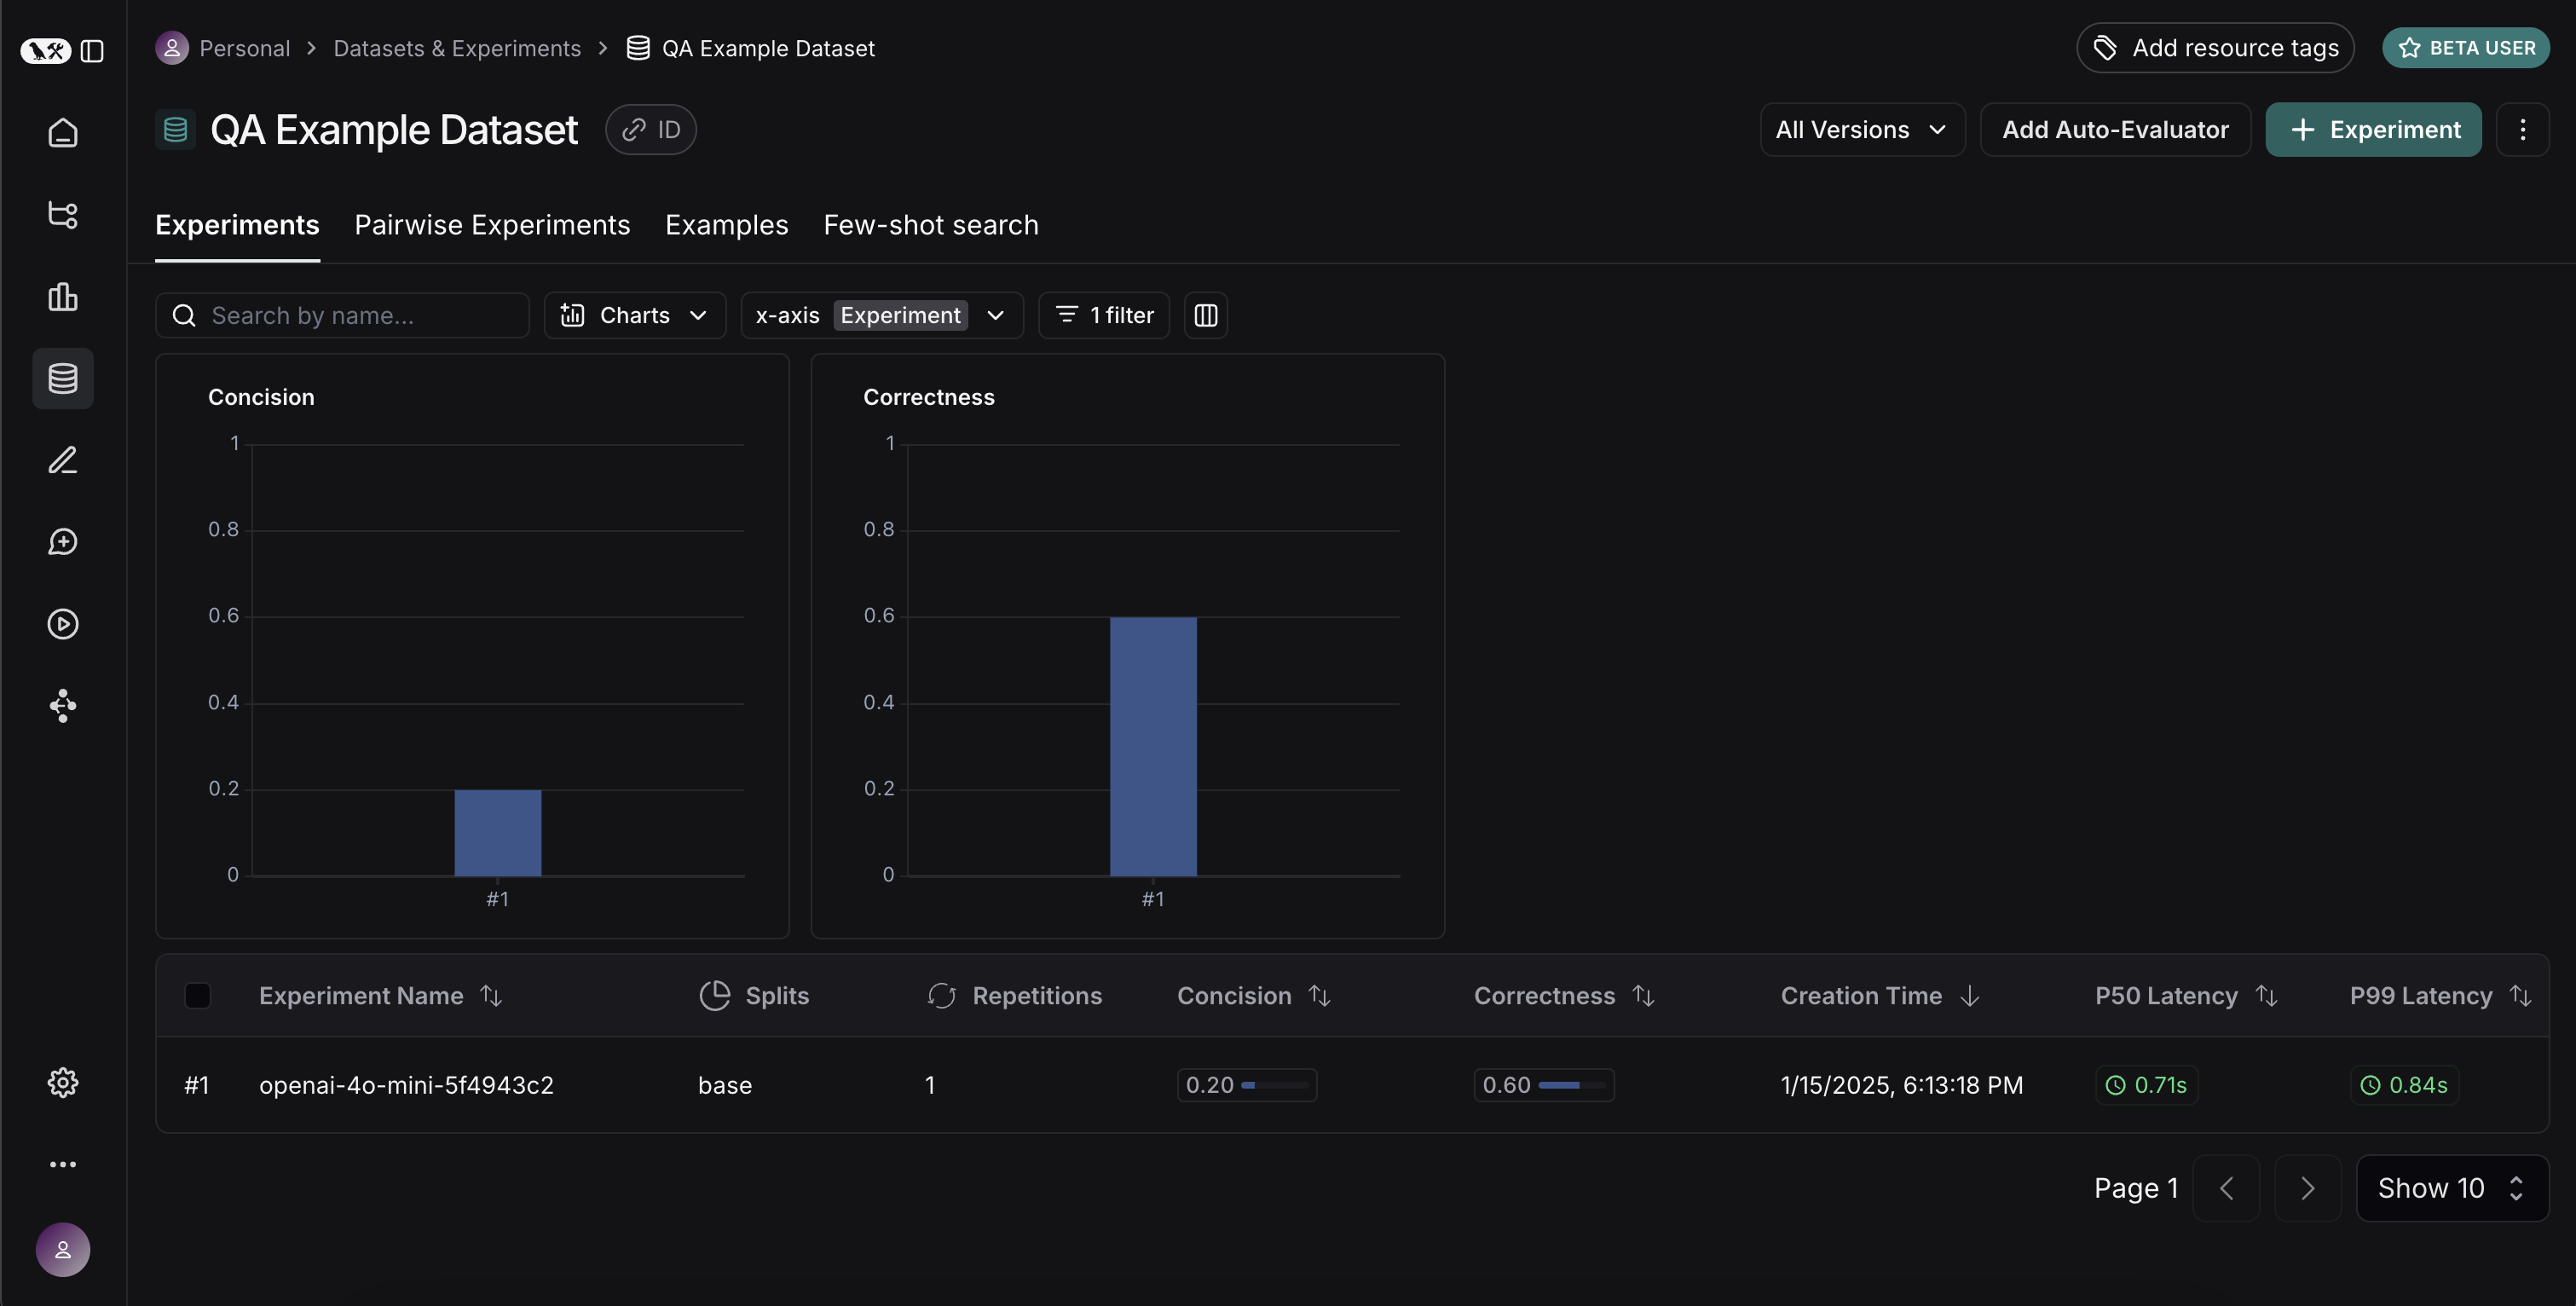
Great! So now how do we run evaluations? Now that we have a dataset and evaluators, all that we need is our application! We will build a simple application that just has a system message with instructions on how to respond and then passes it to the LLM. We will build this using the OpenAI SDK directly: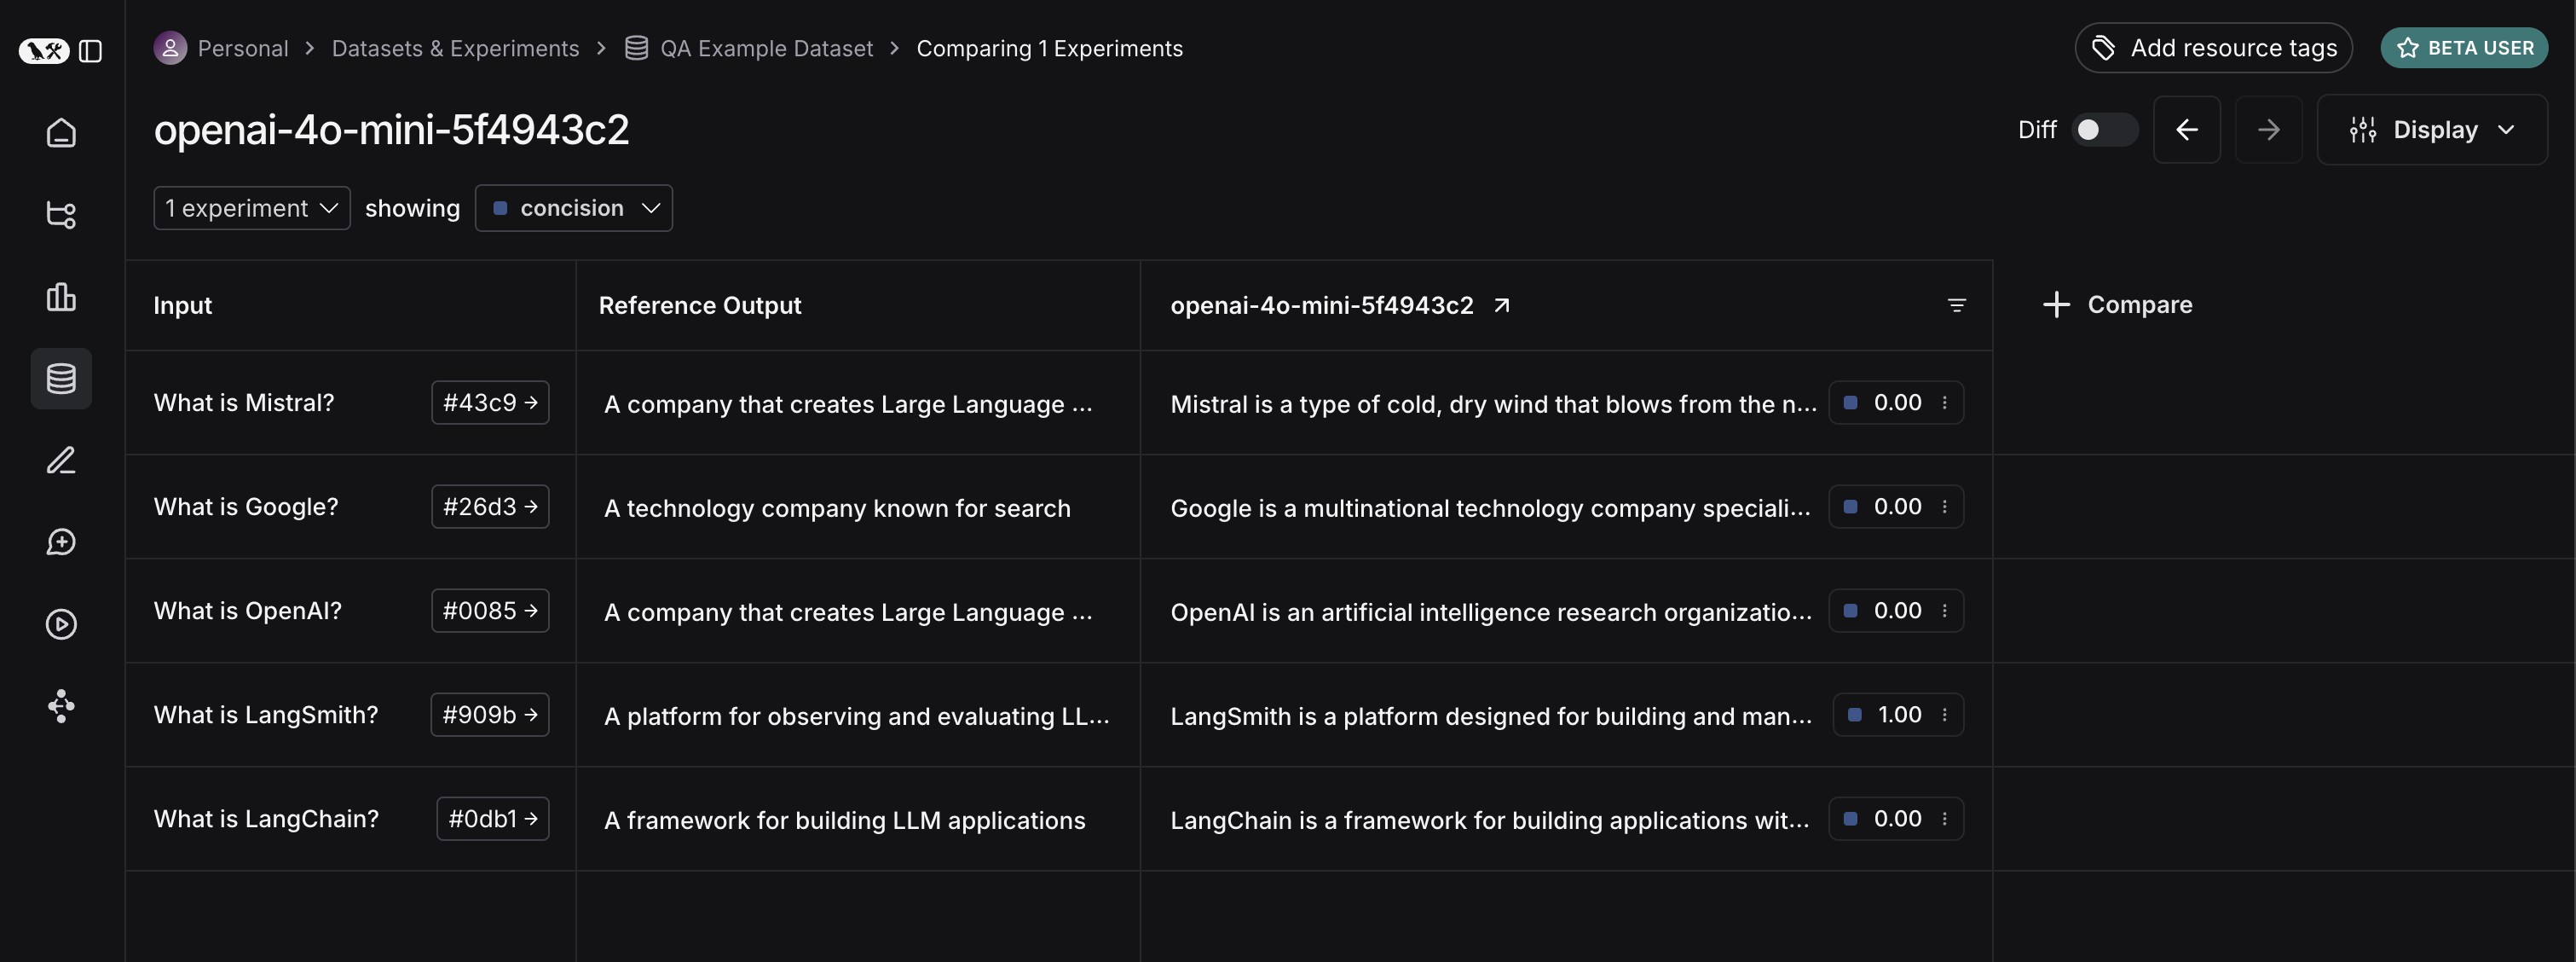 If we go back to the dataset page and select the
 Experiments tab, we can now see a summary of our one run!
 Let’s now try it out with a different model! Let’s try
 gpt-4-turbo
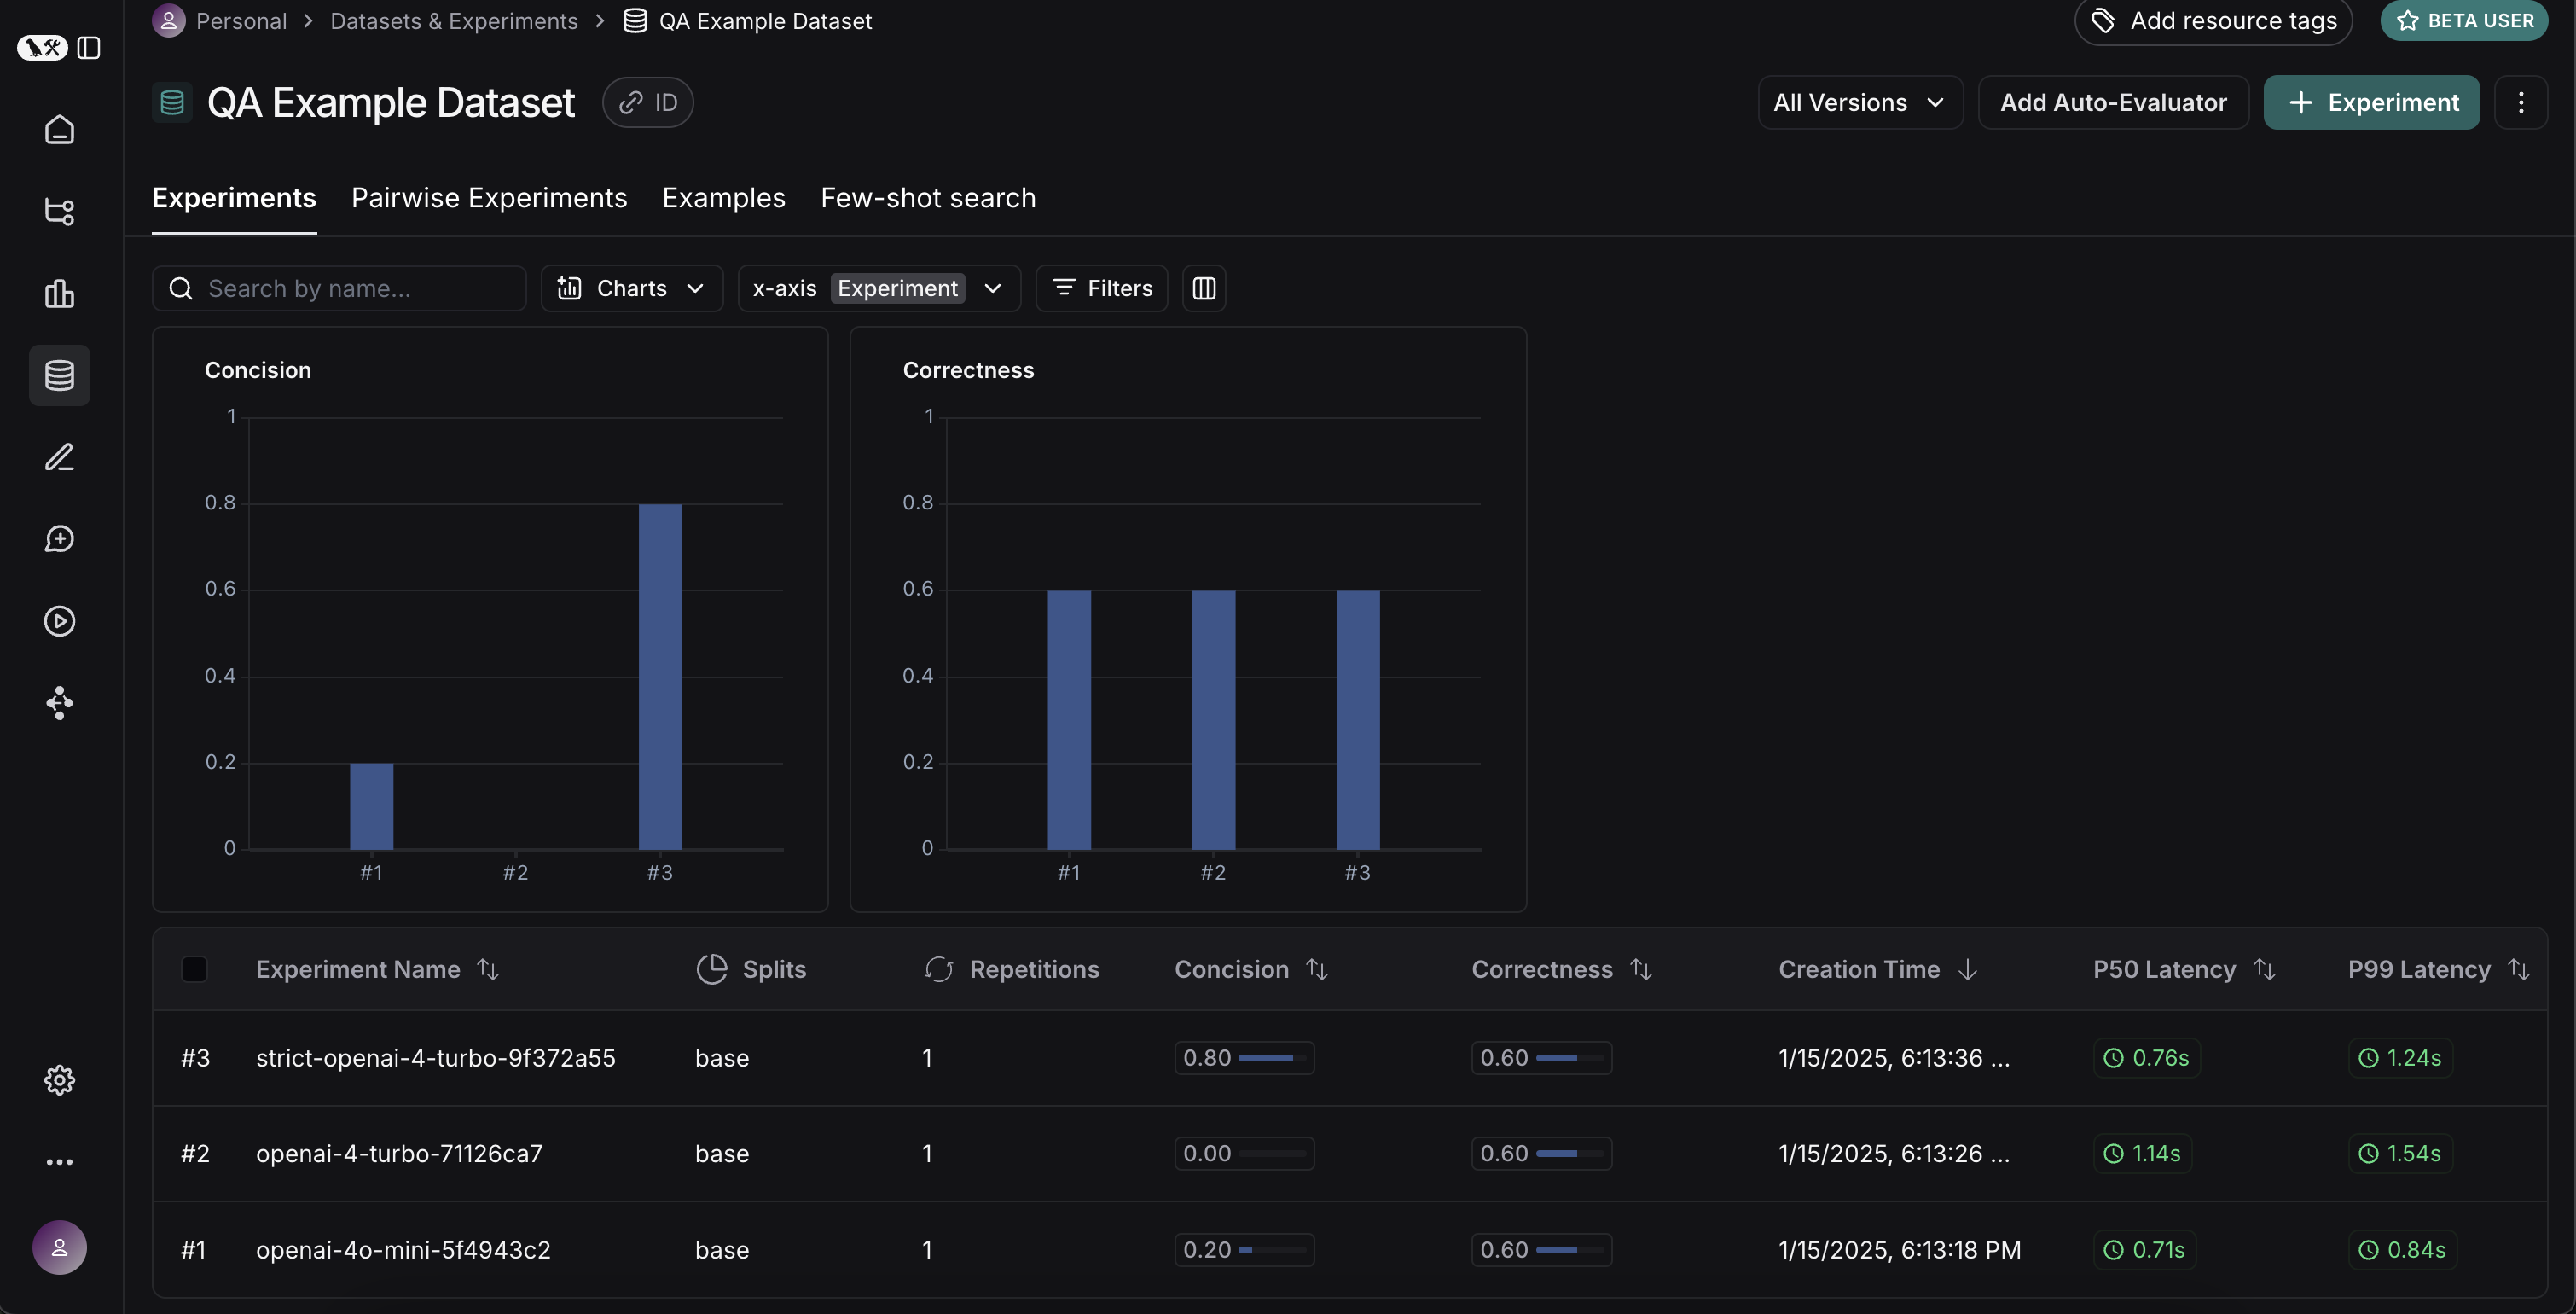
Experiments tab on the datasets page, we should see that all three runs now show up!
Comparing results
Awesome, we’ve evaluated three different runs. But how can we compare results? The first way we can do this is just by looking at the runs in theExperiments tab. If we do that, we can see a high level view of the metrics for each run:
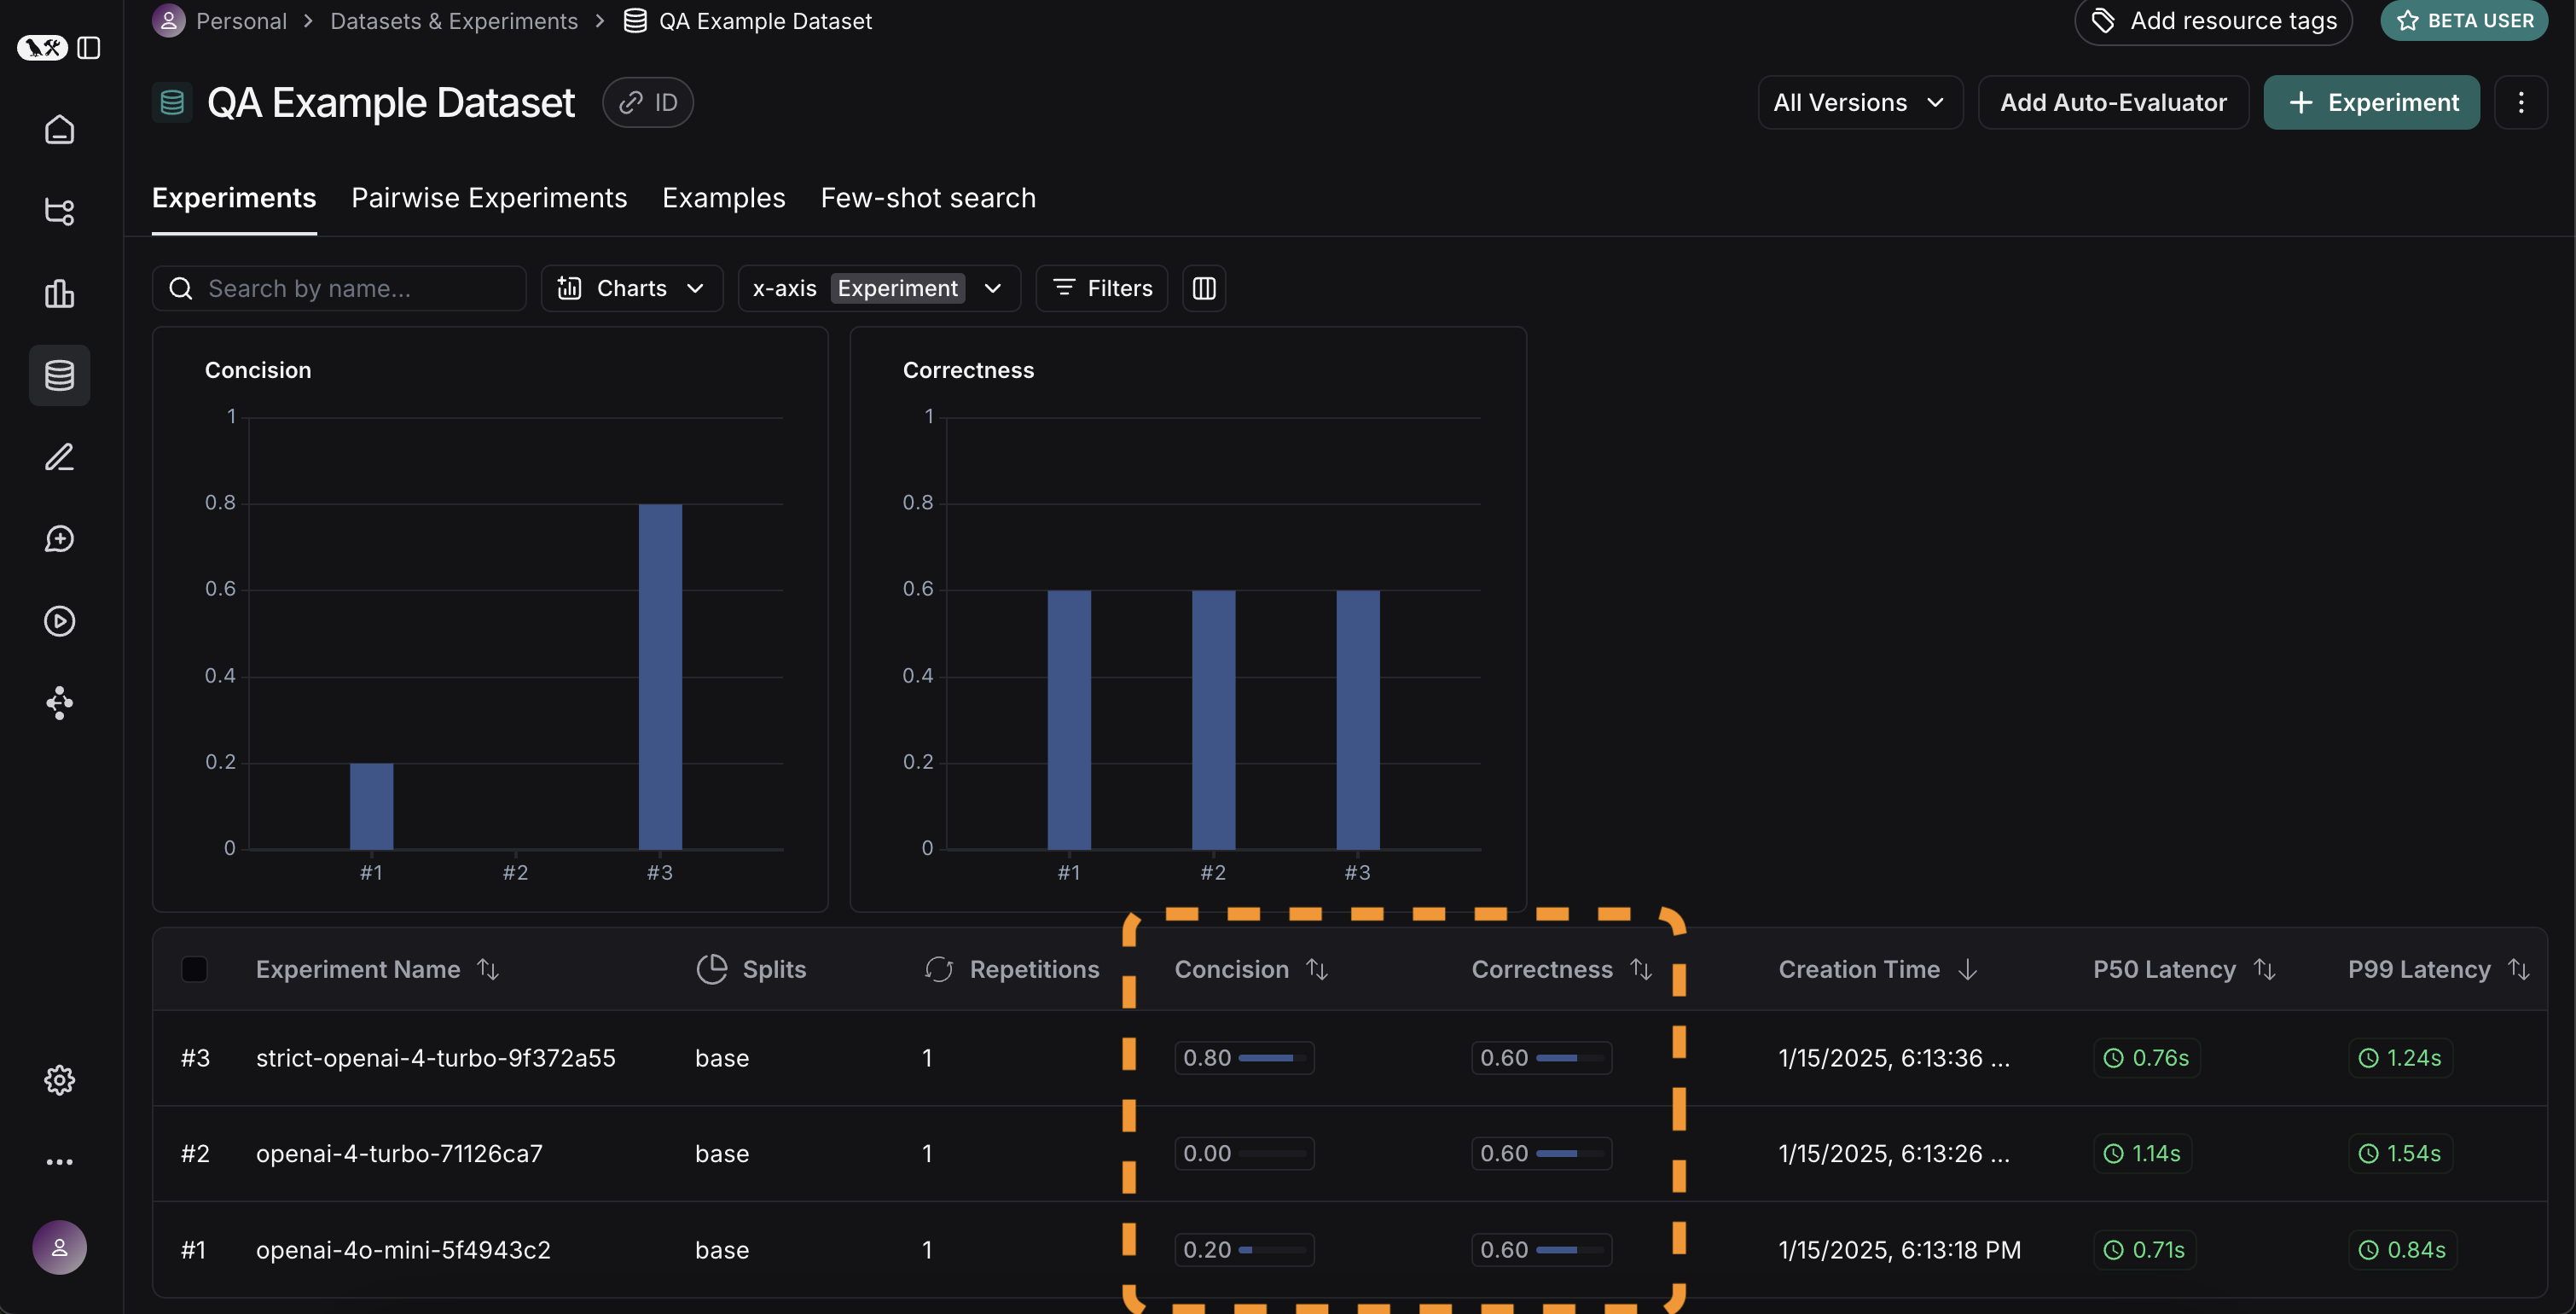 Great! So we can tell that GPT-4 is better than GPT-3.5 at knowing who companies are, and we can see that the strict prompt helped a lot with the length. But what if we want to explore in more detail?
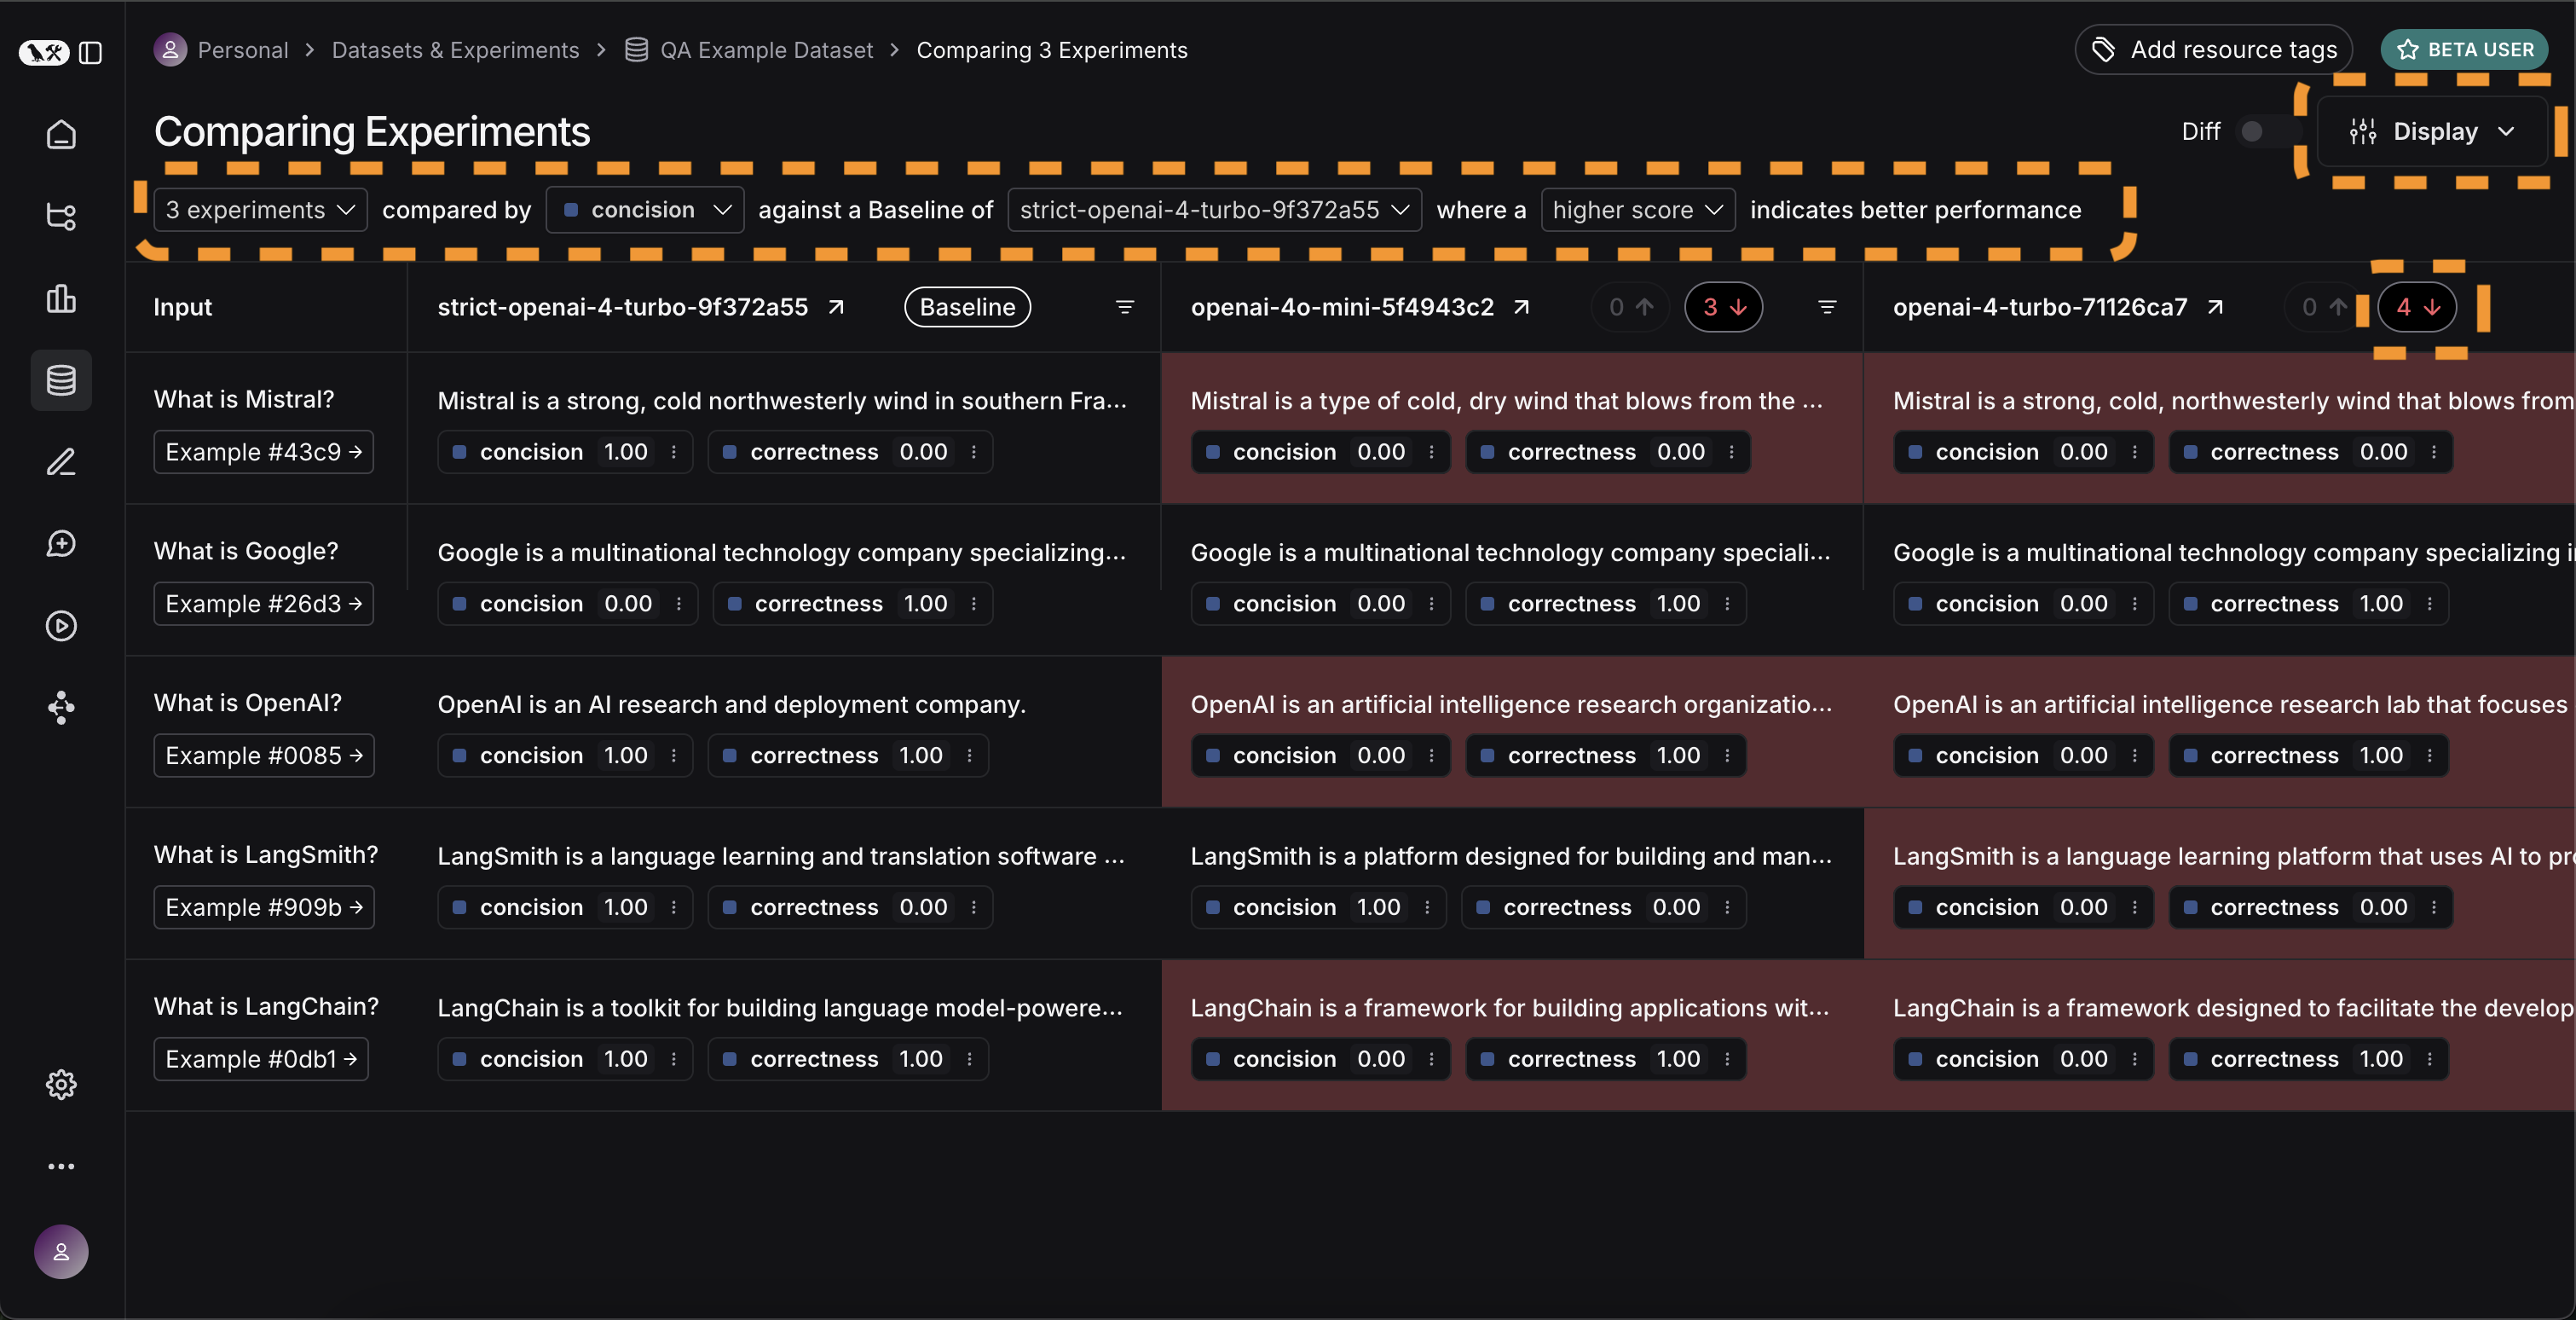
In order to do that, we can select all the runs we want to compare (in this case all three) and open them up in a comparison view. We immediately see all three tests side by side. Some of the cells are color coded - this is showing a regression of a certain metric compared to a certain baseline. We automatically choose defaults for the baseline and metric, but you can change those yourself. You can also choose which columns and which metrics you see by using the
Great! So we can tell that GPT-4 is better than GPT-3.5 at knowing who companies are, and we can see that the strict prompt helped a lot with the length. But what if we want to explore in more detail?
In order to do that, we can select all the runs we want to compare (in this case all three) and open them up in a comparison view. We immediately see all three tests side by side. Some of the cells are color coded - this is showing a regression of a certain metric compared to a certain baseline. We automatically choose defaults for the baseline and metric, but you can change those yourself. You can also choose which columns and which metrics you see by using the Display control. You can also automatically filter to only see the runs that have improvements/regressions by clicking on the icons at the top.
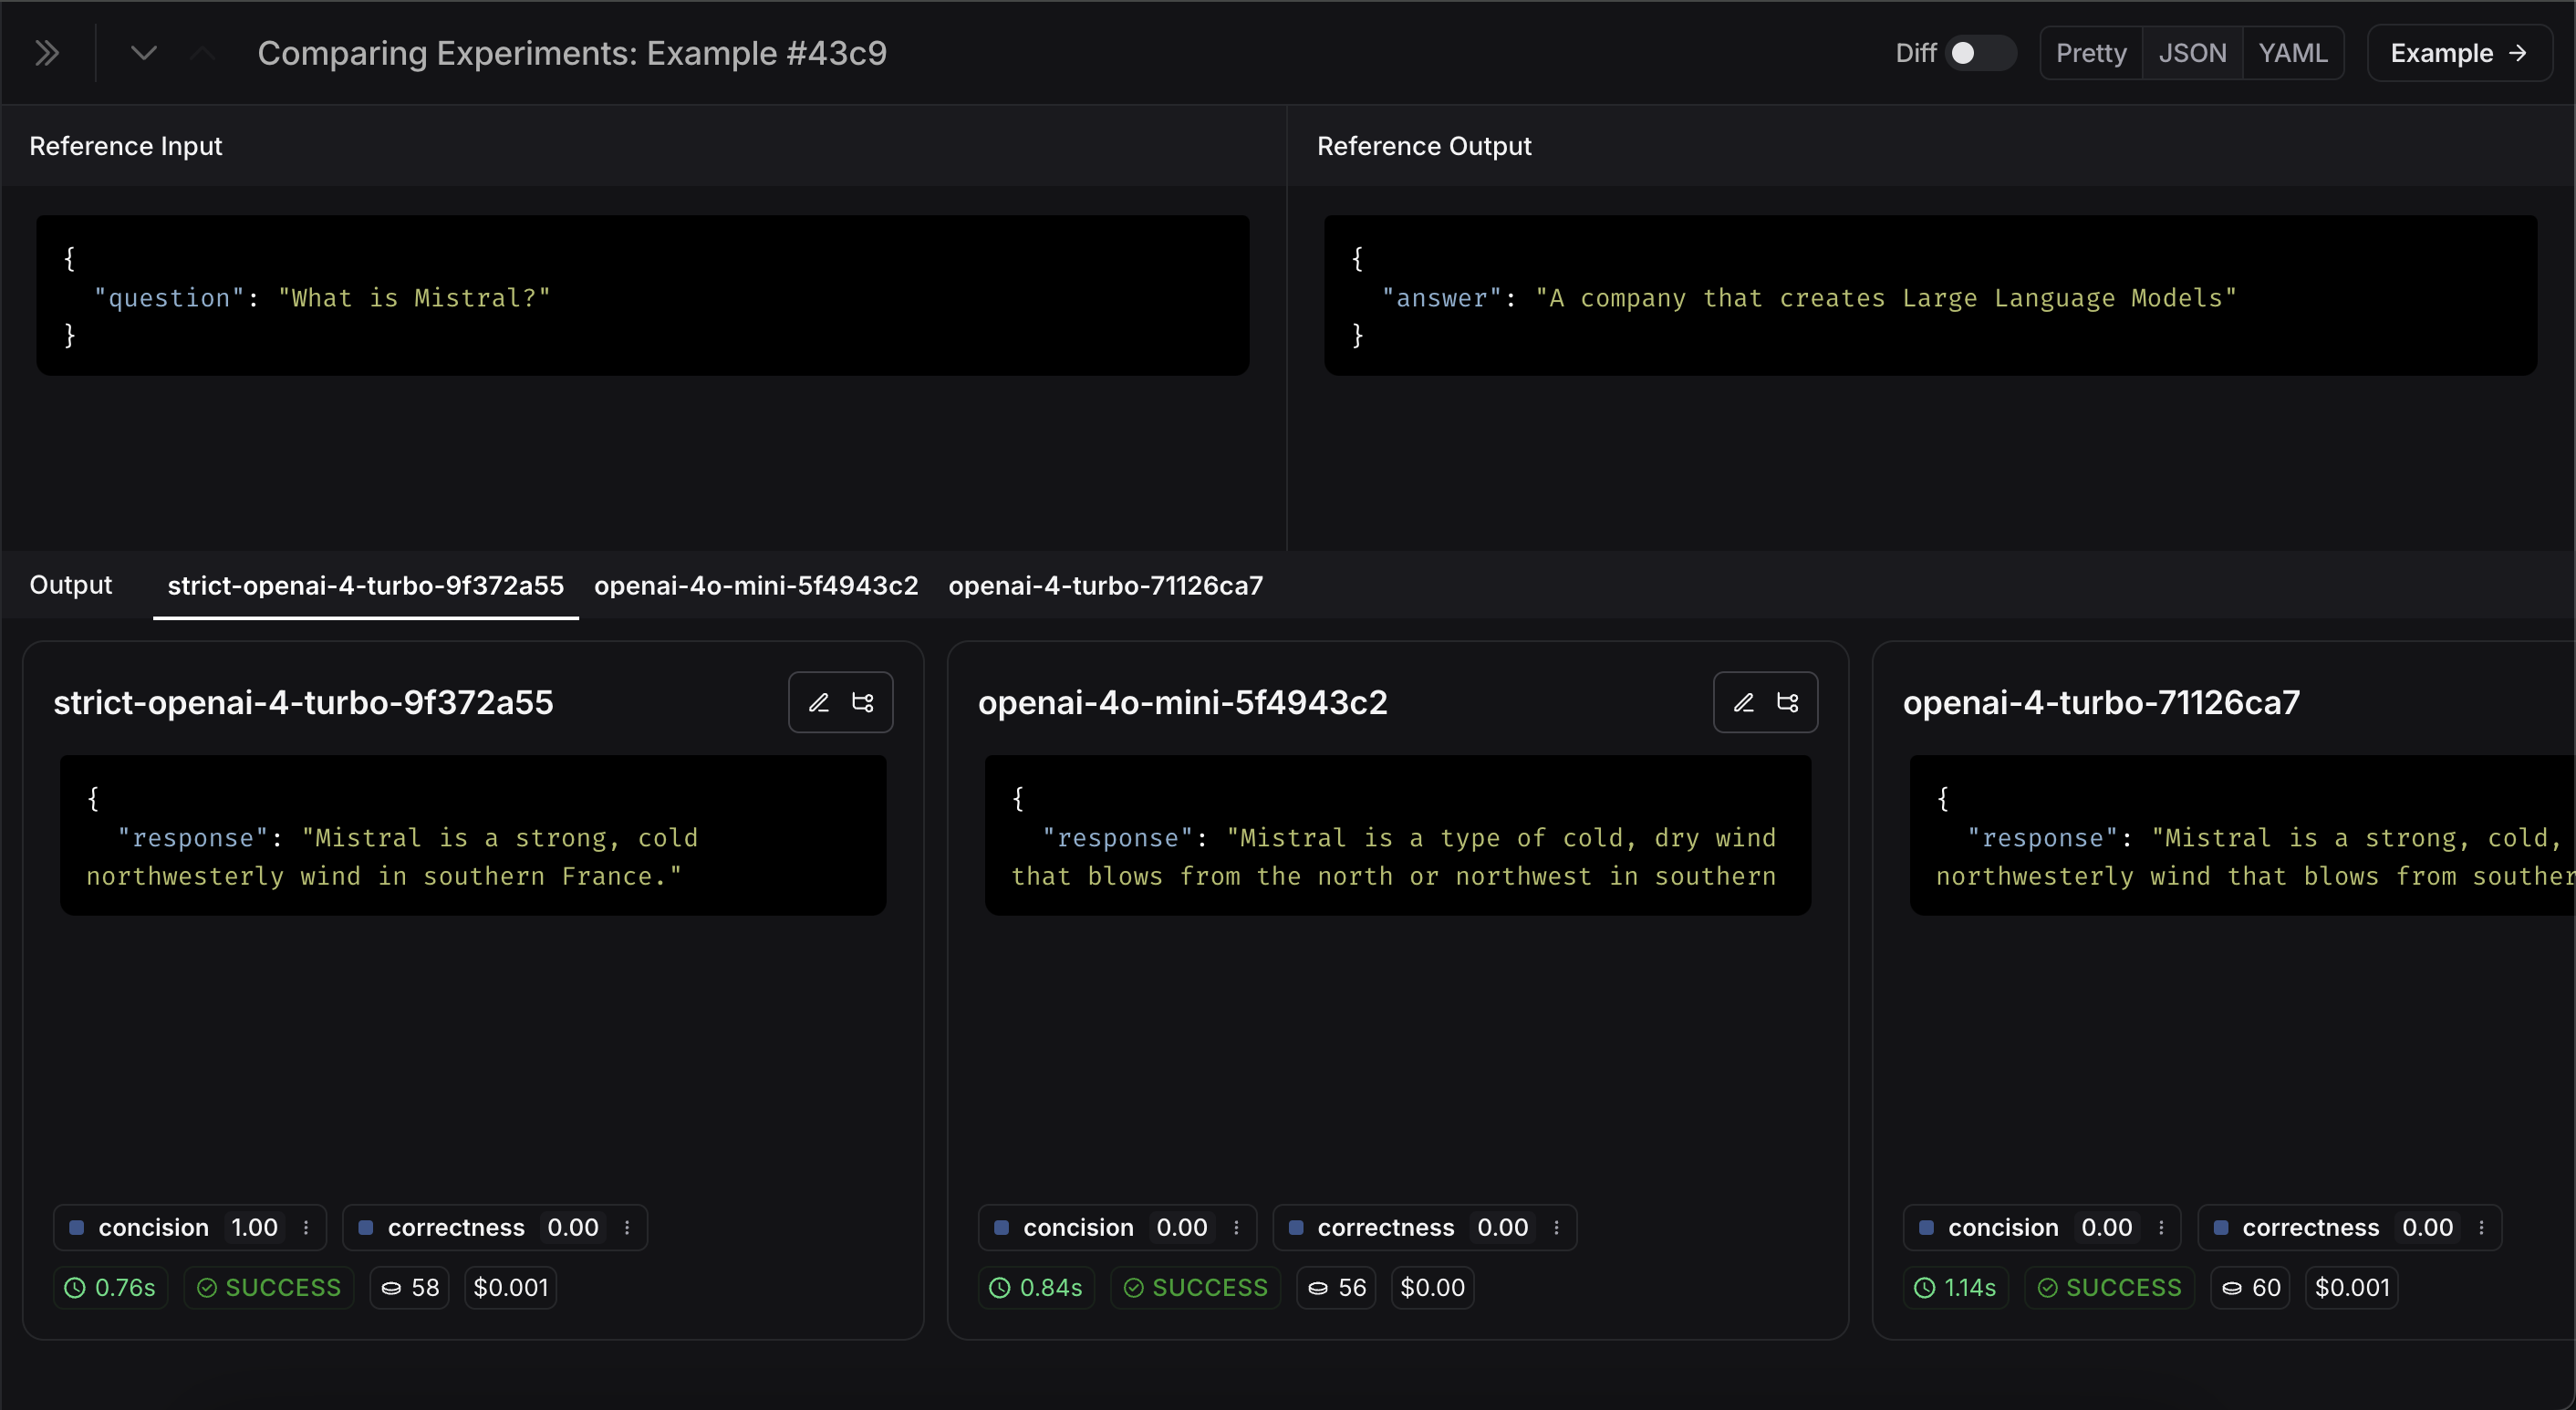
 If we want to see more information, we can also select the
 Expand button that appears when hovering over a row to open up a side panel with more detailed information:
Set up automated testing to run in CI/CD
Now that we’ve run this in a one-off manner, we can set it to run in an automated fashion. We can do this pretty easily by just including it as a pytest file that we run in CI/CD. As part of this, we can either just log the results OR set up some criteria to determine if it passes or not. For example, if I wanted to ensure that we always got at least 80% of generated responses passing thelength check, we could set that up with a test like:
Track results over time
Now that we’ve got these experiments running in an automated fashion, we want to track these results over time. We can do this from the overallExperiments tab in the datasets page. By default, we show evaluation metrics over time (highlighted in red). We also automatically track git metrics, to easily associate it with the branch of your code (highlighted in yellow).

Conclusion
That’s it for this tutorial! We’ve gone over how to create an initial test set, define some evaluation metrics, run experiments, compare them manually, set up CI/CD, and track results over time. Hopefully this can help you iterate with confidence. This is just the start. As mentioned earlier, evaluation is an ongoing process. For example - the datapoints you will want to evaluate on will likely continue to change over time. There are many types of evaluators you may wish to explore. For information on this, check out the how-to guides. Additionally, there are other ways to evaluate data besides in this “offline” manner (e.g. you can evaluate production data). For more information on online evaluation, check out this guide.Reference code
Click to see a consolidated code snippet
Click to see a consolidated code snippet